Nasa now contributes another piece of the puzzle to our understanding how the carbon dioxide cycle works on Earth and how it changes during the course of the year.
The amount of carbon dioxide contained in the air is not constant but varies with the seasons, the Earth breathe CO2 with the seasons.
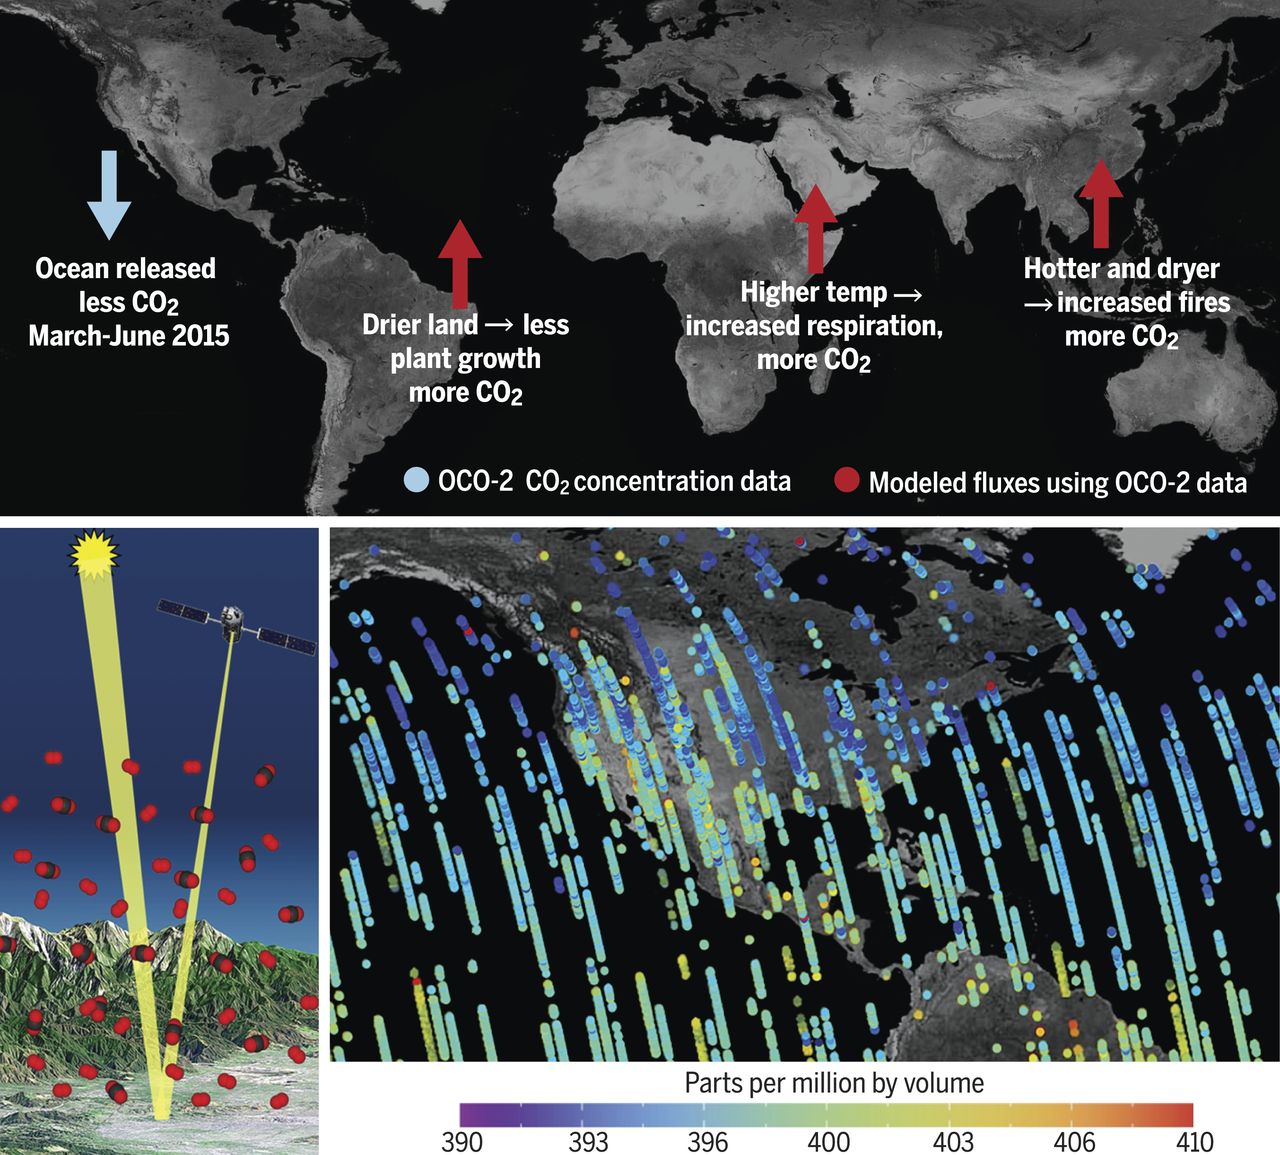
A team of NASA scientists now presents a two-year worth of measurements made by the agency’s Orbiting Carbon Observatory-2 (OCO-2) satellite. Launched on 2 July 2014, the satellite records how much sunlight is reflected off the CO2 molecules in an air column, making measurements in three different spectral bands.
The study published in Science shows how the carbon dioxide levels fluxes in the Northern Hemisphere. It shows where and when photosynthesis takes place, by seeing carbon dioxide being absorbed by plants.
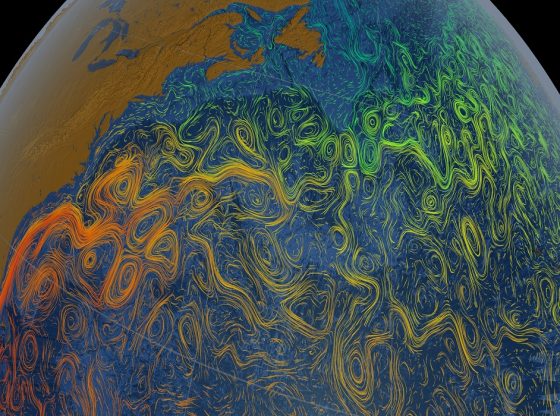
This carbon dioxide visualization was produced by a computer model called GEOS-5, created by scientists at NASA Goddard Space Flight Center’s Global Modeling and Assimilation Office.
In combination with local measurements, the satellite gives us a greater understanding how the planets carbon dioxide cycles work. It is showing us where and when the concentration of carbon dioxide is the highest and the lowest.
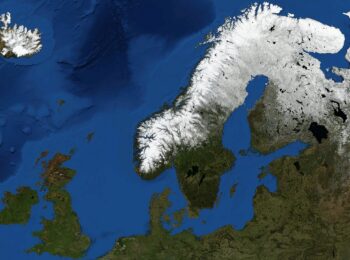
The buildup of CO2 in the Northern Hemisphere during winter and its rapid decrease in concentration as spring arrives (and the SIF increases) is seen in unprecedented detail.
The highest concentrations are seen in cities, responsible for more than 70 percent of humanity’s CO2 emissions. The satellite can discerns differences between cities, rural areas, and even within cities as well.
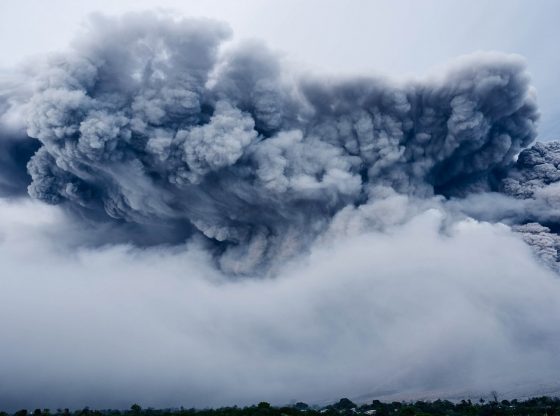
The enhanced CO2 in urban areas relative to nearby background areas is observed with a single overpass of OCO-2. Increases in CO2 due to the biomass burning in Africa are also clearly observed.
The overall idea behind the research was to better understand how humanity is changing the Earth and the data may one day help researchers determine the best regional farming practices and even spot early signs of drought.
The OCO-2 mission data set can now be used to assess regional-scale sources and sinks of CO2 around the globe.
A new satellite, OCO3, is planned to be launched in 2018 to be attached to the International Space Station (although, the fate of OCO-3 is now being deliberated on in Congress. It will be designed to investigate important questions about the distribution of carbon dioxide on Earth as it relates to growing urban populations and changing patterns of fossil fuel combustion.
Reference:
Annmarie Eldering et al. The Orbiting Carbon Observatory-2 early science investigations of regional carbon dioxide fluxes. Science October 13th. DOI: 10.1126 / science.aam5745