The research shows that ten percent of the data’s points of interest account for 80 percent of the spread.
A group of researchers at Stanford University in the US has developed a computer model that very accurately managed to predict the spread of covid-19 in ten large cities in the US during the spring.
The data model succeeds in this by analyzing mobility data from 98 million people using three different parameters:
1) Where the residents go during a day, 2) how long they stay there and 3) how many people visit the place at the same time.
According to the data model, a very small percentage of geographic sites account for as much as 80 percent of the distribution. These consist exclusively of places where people are close together for long periods, such as restaurants, cafes, and gyms.
According to the data model, a limitation of the number of people on these sites can therefore make a big difference both to prevent the spread of the coronavirus but also to dampen the economic impact on the business.
“By combining their model with demographic data available from a database of 57,000 census block groups – 600 to 3,000-person neighborhoods – the researchers show how minority and low-income people leave home more often because their jobs require it, and shop at smaller, more crowded establishments than people with higher incomes, who can work-from-home, use home-delivery to avoid shopping and patronize roomier businesses when they do go out.”
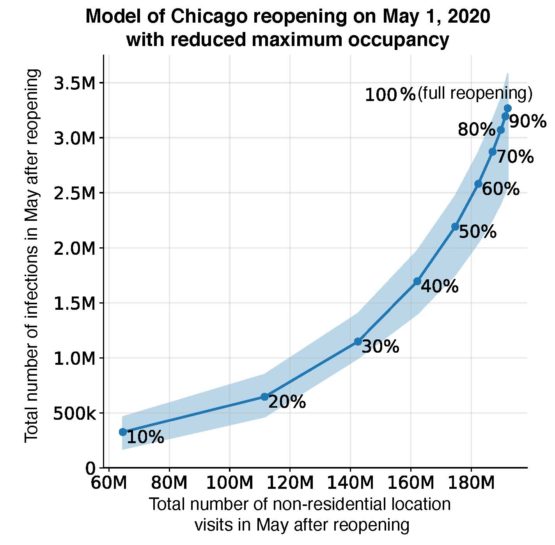
The computer model is intended to be used to help cities in how they can handle the opening of their finances. The researchers’ tools have now been released publicly so that they can be used and developed by more researchers.
“By merging mobility, demographic and epidemiological datasets, we were able to use our model to analyze the effectiveness and equity of different reopening policies,”
– Co-author Stanford Ph.D. student Serina Chang.
“In principle, anyone can use this model to understand the consequences of different stay-at-home and business closure policy decisions,”
– Co-author Stanford computer scientist Jure Leskovec, who led the effort.
The research merges demographic data, epidemiological estimates, and anonymous cellphone location information, and appears to confirm that most COVID-19 transmissions occur at “superspreader” sites, like full-service restaurants, fitness centers, and cafes, where people remain in close quarters for extended periods.
The team is now working to develop the model into a user-friendly tool for policymakers and public health officials. The study has been published in the journal Nature.
Reference:
Chang, S., Pierson, E., Koh, P.W. et al. Mobility network models of COVID-19 explain inequities and inform reopening. Nature (2020). https://doi.org/10.1038/s41586-020-2923-3