The so-called “fiscal cliff” looming in the United States have probably not escaped anyone. What media often presents a situation where the US economy is heading towards a very negative outcome indeed. But what has seldom explained is why, and how.
Taxes, Government Debt and Aggregated Demand
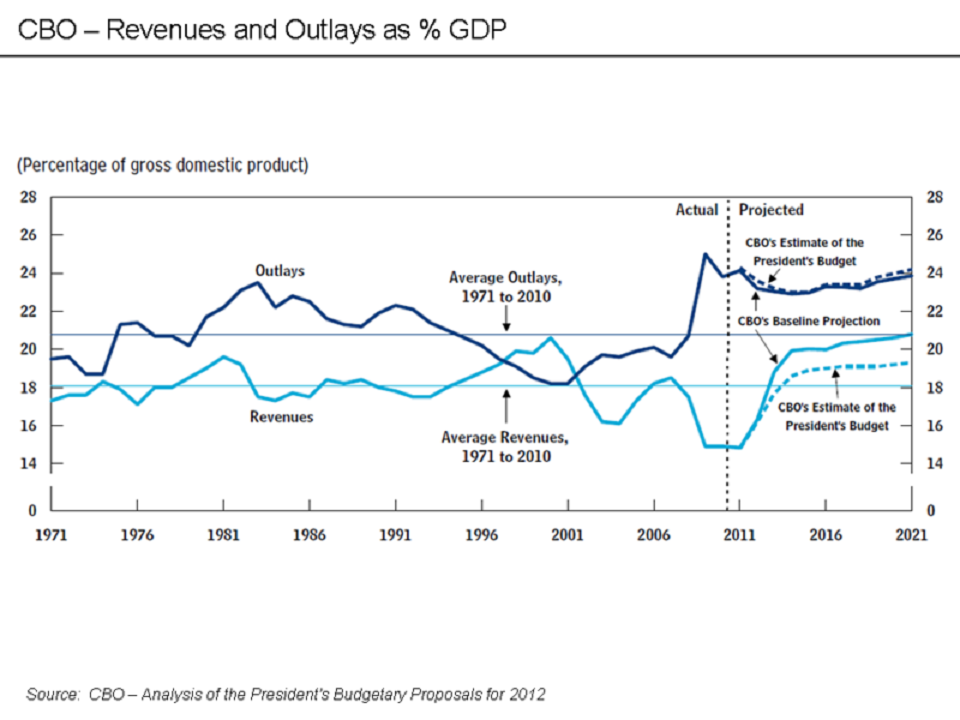
The so-called “fiscal cliff” (in January 2013) refers to the economic effects that result from tax increases due to tax cuts from the Bush-era expiring. Spending cuts and therefore a reduction of the US budget deficit beginning in 2013. The difference between what the government takes in and what it spends is projected to be roughly half in 2013.
This combination of factors would result in a reduced budget deficit and an improved government debt, in the long run, this doesn’t sound all that bad, right?
The problem is that higher taxes although good for the government budget and federal debt, is correlated with negative short-run effects – effects that in the current state of recovery from recession in the US and the world economy could prove essential, possibly leading to a new mild recession – that is what the critics say at least.
A Short Summary
To provide a brief summary of the current situation for the US economy. The United States presently has a budget deficit, a growing government debt, a trade deficit and the economy is growing at very low rates. The economy is considered far from potential level and full employment.
First a short economic background to the factors in play in the U.S economy: Economists describe economic activity in a country with the function Y=AKaL1-a, growing with capital accumulation, labor and technology (innovation and productivity increase) with derivatives of the so-called Cobb-Douglas function with capital per actual worker (Δk = sf(k) – (δ + n + g)k) and at “steady state” (depreciation of capital equals investments) growing in output with “g” (technology) per worker, “g” and “n” (number of workers) in total output.
Deficit and Debt
There are three ways of decreasing the budget deficit and the debt; increasing income, decreasing spending and economic growth.
Higher taxes increase government income and therefore improve the budget deficit, but also affects aggregated demand in the short term. As it means negative effects for regular people by directly decreasing after-taxes income. This makes consumers decrease spending and consumption, thereby also decreasing aggregate demand.
Decreasing spending improves the budget deficit, but may affect total aggregated demand in the short term and may imply diverse negative effects for regular people depending on where the cuts are made.
The third variable is economic growth, which increases income in the long run. But would be higher if aggregate demand is increased and not decreased as for the situations mentioned above.
Low Economic Activity
There is essentially a duality of effects resulting by imposing either one of the above actions. There is a trade-off between dealing with deficit and debt and keeping the economy going.
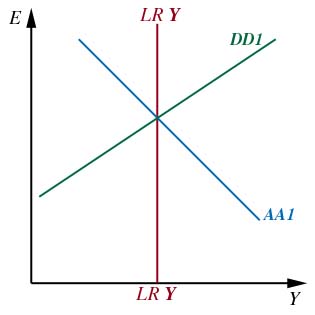
By increasing taxes there is a situation that can be described as seen in the diagrams below (the economic functions and equations from which these diagrams are derived from will not be examined in this article).
The DD curve slopes upwards because of a rise in the exchange rate, all else equal, causes the output to rise. Showing the relationship between output and the exchange rate. It shows the combinations of output and the exchange rate at which the output market is in short-run equilibrium, where aggregate demand = aggregate output.
For example, increased government spending results in a higher aggregate demand and a higher output in equilibrium. Output increases for every exchange rate: the DD curve shifts right.
The inverse relationship between output and exchange rates needed to keep the foreign exchange market and money market in equilibrium is summarized in the AA curve.
The asset market equilibrium schedule AA slopes downward because of a rise in output, all else equal, causes a rise in interest rate and a domestic currency appreciation. For example, an increase in the money supply reduces interest rates, causing the domestic currency to depreciate (a rise in E) for every Y: the AA curve shifts up (right).
The Trade-Off: Short Run
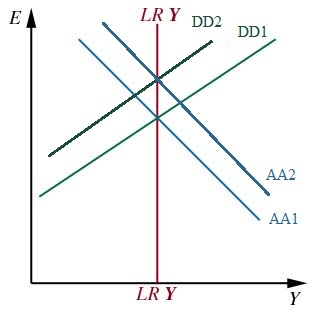
Higher taxes generally decrease consumption expenditure, decreasing aggregate demand and output for every exchange rate: the DD curve shifts left. In the short run. The DD curve shifts to the left leading to a currency appreciation, and a lower output. Therefore the risk of, as the critics say, a reduced GDP growth rate and possible recession.
The Trade-Off: Long Run
The situation alters in the long run, however, when slow economic variables shift and adjust to the current climate, the equations change. All economies consist of “sticky” or slow moving variables, changes in planned output, prices, or changes in expectations.
In the long-run a permanent fiscal contraction (higher taxes) changes exchange rate expectations, it shifts the AA curve to the right, as it shifts DD to the left. The effect on output is nil if the economy starts in the long run equilibrium.
To Summarize
The trade-off between short-run negative effects on the US economy and long-run positive effects on debt reduction is what lies at the heart of the current dilemma.
It is simply a question of priority that provides the answer to what needs to be done, and that is a political question.
If deficit and debt are given a higher priority than the current state of US economic growth. Or perhaps a middle way and a compromise.
Economic models provide answers to what would happen in different scenarios. It is however up to politicians to set the future agenda.